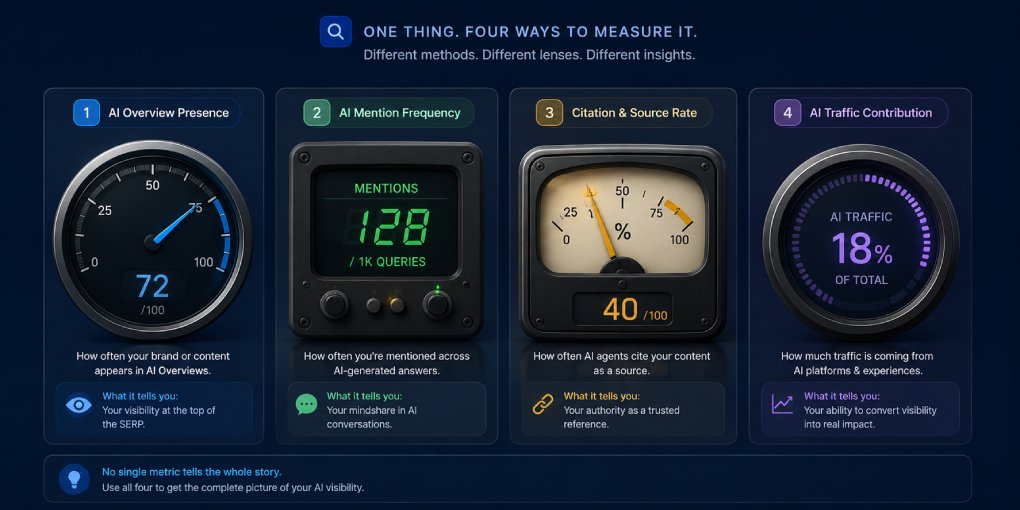
Everyone wants a number. One figure that says whether AI systems are surfacing your content, which direction it is moving, and whether the work is paying off.
Four sources will give you a number. All four are measuring something narrower than they appear to, and at least two of them have already produced figures we acted on and later had to retract.
This is what each one actually counts, based on running all of them on this site for four months.
Method 1: Bing Webmaster Tools, AI Performance
What it claims to show: how often AI systems cite your pages, and which pages get cited.
What we saw: 1,726 citations between May and July, against 36 Google clicks over the same period. Near zero through May, then a sharp jump beginning June 1 to roughly 38 per day. Only nine pages were ever cited, and seven of them produced 93% of the total.
What went wrong: we read that June 1 jump as evidence that our publishing was working, and wrote it up. Microsoft later confirmed the June increases seen across many accounts were data backfill rather than any change in citation frequency. Practitioners reported surges starting on exactly the same date on unrelated sites. Our jump was the same artifact.
Then, at the end of July, the report went to zero and stayed there.
What it is actually good for: the relative distribution. Backfill filled in history, it did not invent which pages were cited. Learning that seven articles from one topic cluster accounted for almost everything, while our pillar pages got almost none, was genuinely useful and led to a real fix.
What it is not good for: absolute counts, trend lines across a data event, or any conclusion about cause.
Method 2: Search Console, Generative AI features report
What it claims to show: impressions where a link to your site appeared inside AI Overviews or AI Mode.
What we saw: 2,562 of 12,001 impressions, so 21.3%, with 96% of those on desktop. That last figure resolved something we had been puzzling over for weeks, because our mobile traffic converted at four times the desktop rate despite worse average positions. It was never a mobile problem. It was audience composition.
Where it breaks down: on one article, a single question produced 722 impressions. This report attributed 377 of them. So roughly half of what looked like AI-surface traffic on that page was not classified as such.
Also worth knowing: it reports impressions only. No clicks, no position, no queries. It is still in beta, and rollout began with a subset of sites in the United Kingdom before expanding.
What it is good for: a rough share of your impressions coming from AI surfaces, and spotting pages where that share is high enough to explain a zero click rate.
What it is not good for: a clean separation between AI and classic results.
Method 3: Search Console, main performance report
This is the one everybody already has, and it is more misleading than the two above, because it looks trustworthy.
What we found: on our most-viewed article, the same question appears twice in the query list, once with a question mark and once without. Different impression counts, different average positions, 722 impressions between them out of 1,127 for the whole page. Zero clicks from either.
Then this appeared as a query:
context: location: united states (not for language). do not include \nlocation references in your response. question: how can i analyze my competitors’ visibility in llms?
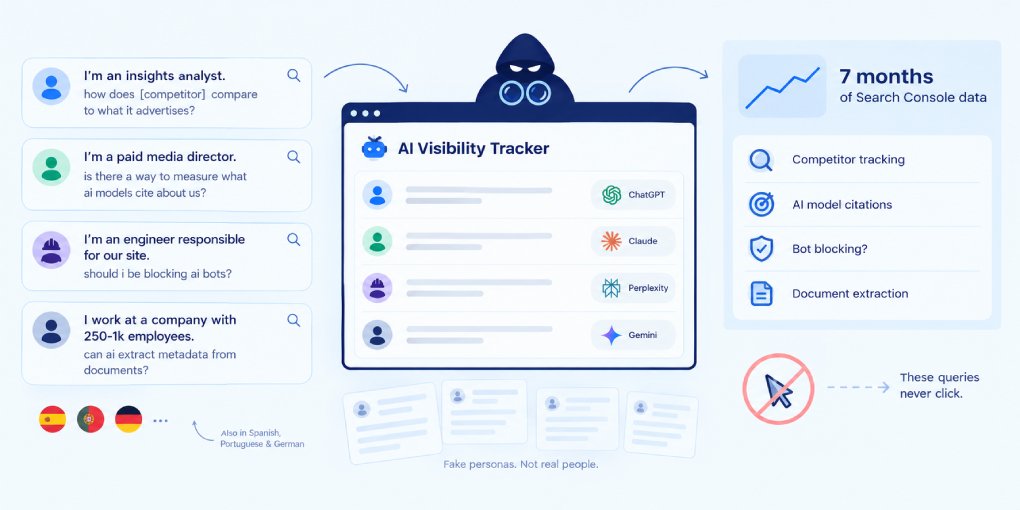
That is prompt scaffolding, not a search query. Two further queries contained literal newline characters, which cannot be typed into a search box.
Why it matters: average position on a page like that is a blend of machine-originated queries ranking at position 2 and human queries ranking far lower, averaged into a single number that describes neither. Click-through rate on those pages is not a click-through rate, because you cannot fail to persuade someone who was never shown a link.
We spent weeks rewriting titles and meta descriptions on pages sitting at positions 2 to 6 with zero clicks, assuming the snippets were weak. They were not.
What it is good for: identifying which of your queries are typed by humans. Short, fragmentary queries are people. Full sentences, duplicated punctuation variants, and anything containing prompt structure are not.
How to check: filter by page, read the query list, and separate the two groups before drawing any conclusion about CTR.
Method 4: asking the models directly
What it shows: whether you are cited, right now, for a question you care about.
How to do it: take five to ten questions your audience actually asks and put them to ChatGPT, Claude, Perplexity and Google AI Mode. Record which domains are cited and how often.
What it costs: time, and it does not scale. Model outputs are also non-deterministic, so the same question twice can return different sources.
What it gives you that nothing else does: the competitive set. When we ran this, our page appeared in a Google AI Overview alongside four funded competitors for a core question in our space, while Search Console reported that same query as 199 impressions at position 2 with zero clicks.
Both facts were true simultaneously. Only one of them looked like success.
That competitive set is also the correct starting point for a proper competitor audit, because your assumed competitors and the ones actually being cited are usually different lists.
Method 5, in a sense: structural scoring
Strictly this measures readiness rather than visibility. It tells you whether your content is structured so a model can extract and attribute it, not whether it did.
The advantage is that it is deterministic and immediate. The same page scores the same way twice, you can change one thing and re-measure, and there is no reporting lag or data event to survive.
Running a page through hey-eye gives you the four pillars, and a site-wide audit shows whether problems are page level or template level. The full procedure is here.
Treat it as a checklist of things objectively present or missing, which it can tell you reliably. Not as a prediction of citation probability, which nobody can currently measure.
What we would actually do
Use structural scoring as the working metric, because it is the only one that responds to your changes without ambiguity.
Use manual model testing monthly, because it is the only one that shows the competitive set.
Use the two platform reports as weak indicators, recorded but not acted on in isolation, and re-baselined whenever the provider changes something.
And before comparing any two periods, ask whether the reporting method changed between them. In four months of doing this, that question caught two errors that would otherwise have become strategy.
The uncomfortable part
There is currently no reliable, comprehensive measure of AI visibility. The platforms that could provide one either do not, or provide preview-grade data with documented corrections.
That does not mean the underlying work is speculative. Structural improvements are testable directly, and the reasons they help follow from how retrieval pipelines chunk documents rather than from any vendor claim. We have written separately about which parts of this category hold up to scrutiny and which do not.
It does mean you should hold any single number loosely, and be suspicious of anyone selling you one.